Reports & Analytics
PhishSpot provides several ways to analyze your campaign results and track your organization’s security posture over time.
11.1 Campaign Reports
Section titled “11.1 Campaign Reports”Each campaign has its own dashboard (see section 4.5) with detailed funnel charts, recipient tables, and group breakdowns. You can export individual campaign reports in two formats:
-
PDF Report — A formatted document suitable for sharing with management.
-
Excel Report — A spreadsheet with raw data for further analysis.
11.2 Cumulative Reports
Section titled “11.2 Cumulative Reports”From the campaigns list page, you can generate cumulative reports that aggregate data across all campaigns. This is useful for quarterly or annual security awareness reviews.
11.3 Trend Dashboard
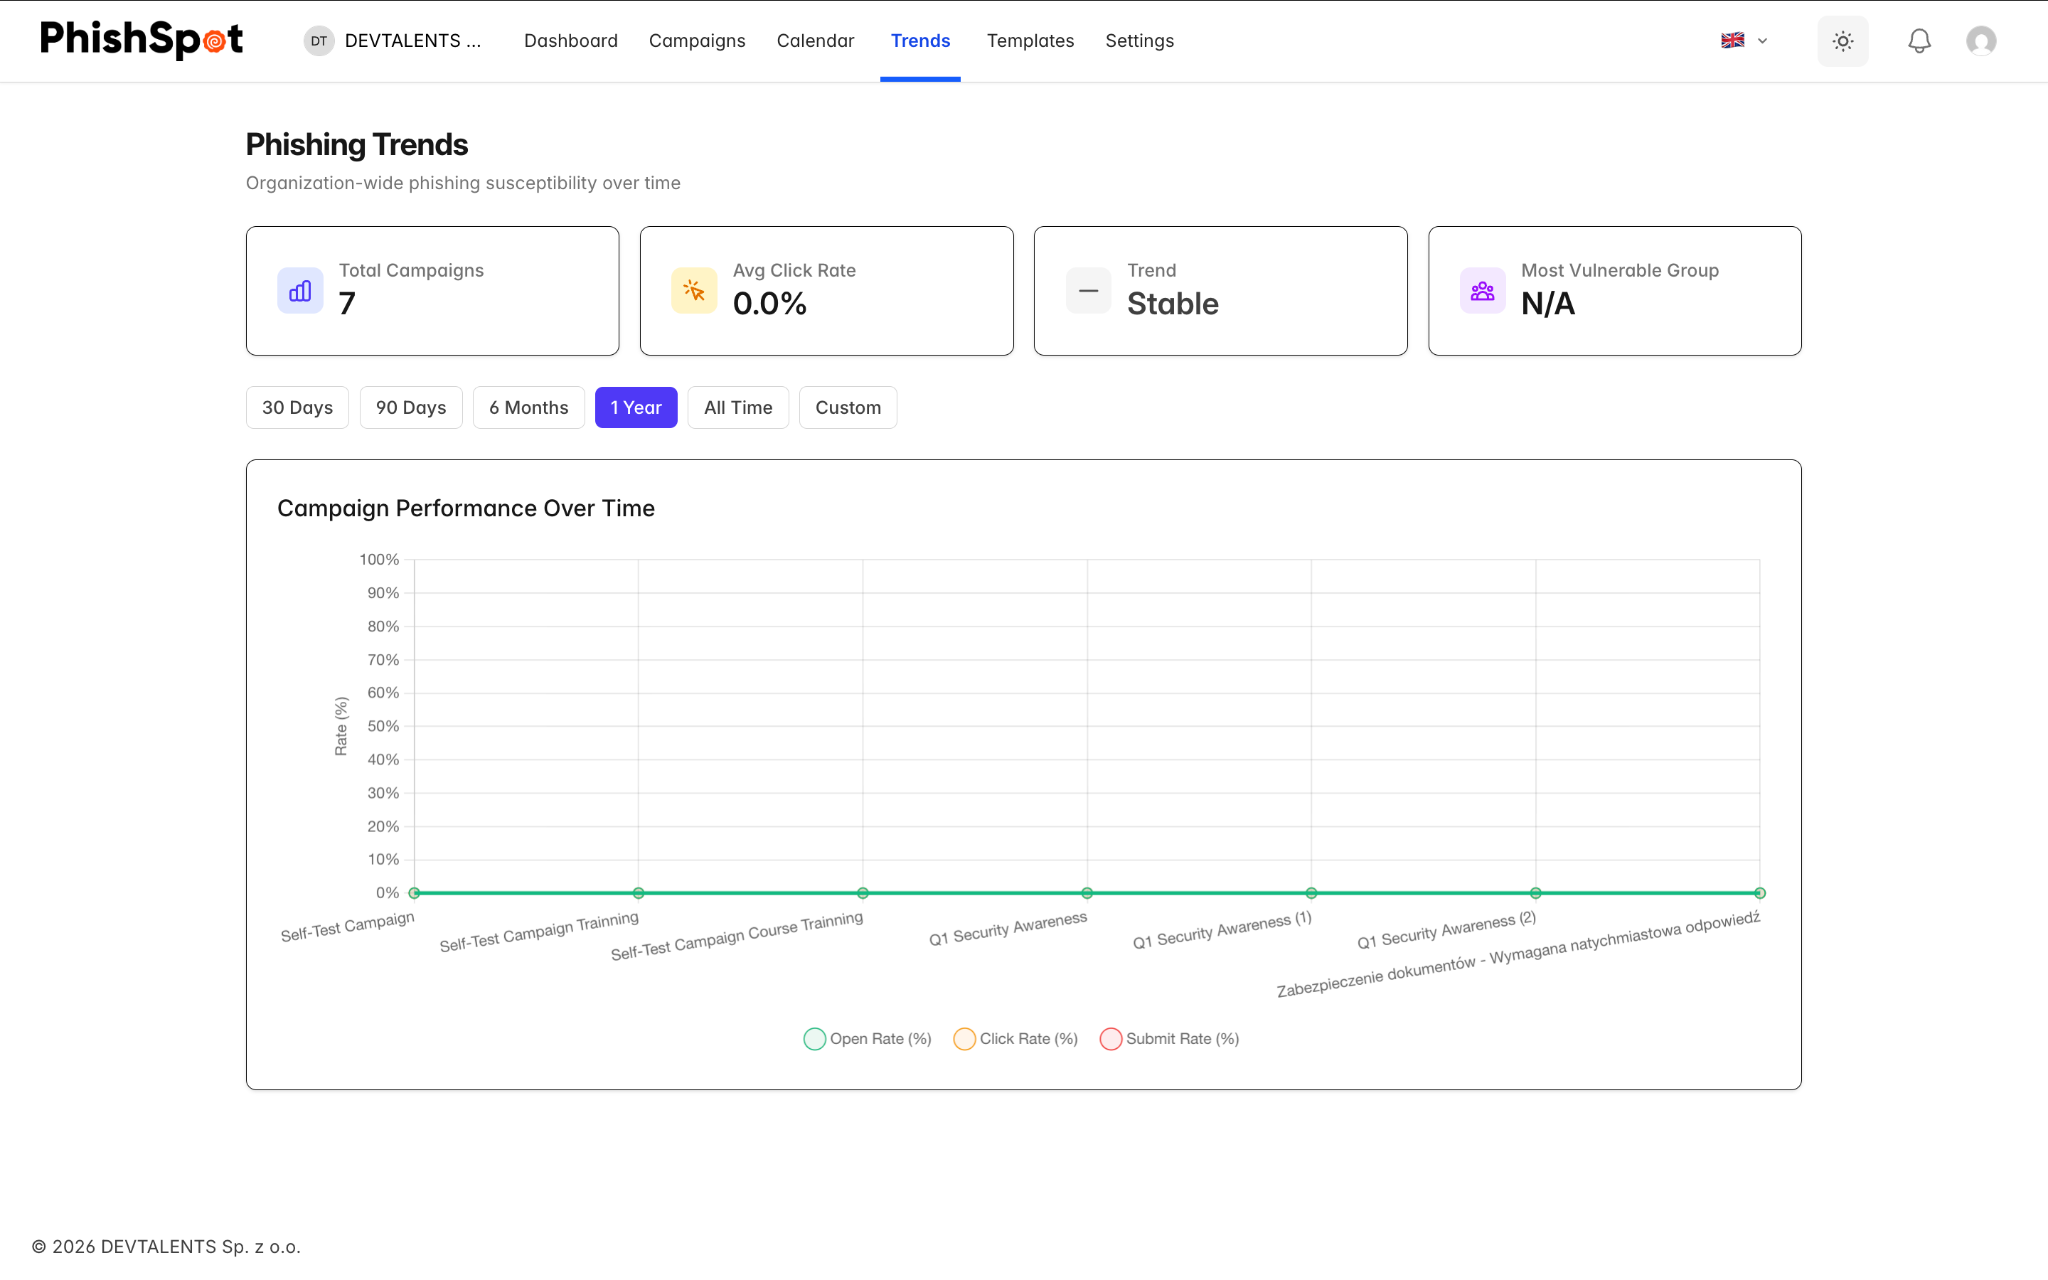
Section titled “11.3 Trend Dashboard”Navigate to Trends from the sidebar to access the trend dashboard. This view shows historical performance data across all your campaigns with date range filtering options: 30 days, 90 days, 6 months, 1 year, all time, or a custom date range.
The trend dashboard helps you answer questions like: Are employees getting better at recognizing phishing emails over time? Which departments need additional training? Is the click rate decreasing campaign over campaign?
11.4 Recipient Timeline
Section titled “11.4 Recipient Timeline”Within any campaign dashboard, clicking on a recipient opens a detailed timeline panel showing every tracked event for that person: when the email was sent, when it was opened, when the link was clicked, when the landing page was viewed, whether data was submitted, and whether the training course was started or completed.
11.5 Previewing the email each recipient received
Section titled “11.5 Previewing the email each recipient received”Every row in a campaign’s Recipients table has a small magnifier-on-envelope icon next to the recipient’s email address. Click it to open a modal showing the exact email that contact received — with every template variable ({{first_name}}, {{company}}, {{position}} …) substituted with that contact’s actual values, the actual landing-page URL embedded, the actual From: address used. Not a generic preview: the rendered mail for that specific recipient.
The modal has a desktop / mobile viewport toggle at the top — flip between the two to see how the email looked on a 1920px-wide Outlook client vs. an iPhone Mail rendering. Useful during stakeholder review of a finished campaign (“show me exactly what Anna saw on her phone”) and during incident investigations (“did the link in this specific delivery target the right domain?”).
The same preview is also available from a contact’s individual deliverables view — open any contact’s detail page and the deliverable rows have the same magnifier. Two perspectives on the same modal: per-campaign (every recipient on one campaign) and per-contact (every campaign one person received).